Diagram of percentage |


|
|
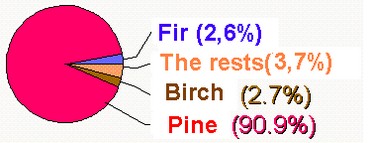
The diagram of percentage is the circular diagram with sectors having the size according to the relation of value of a processed field of the table to total value (100 %). For 100 % the sum of values of all analyzed characteristics for the given object can be accepted, the value corresponding to 100 % can be received from a field of the table or semantics of object. Besides, values of analyzed characteristics for object can be perceived as absolute values of percent. In case total value is chosen of a separate field of the table or of semantics of object, the difference between total value and the sum of analyzed characteristics belong to "the rest". Besides, the values of characteristics, which are not exceeding the specified value (Belong to the rest at less than … %) belong to "the rest". In case the sum of analyzed characteristics surpasses total value, the sum of characteristics is taken as 100 %. As the analyzed characteristics for construction of the diagrams of percentage the numerical fields or semantics can be used only.
|