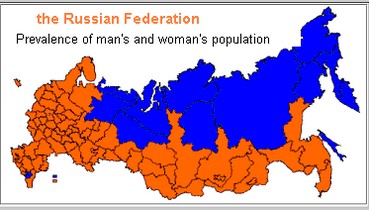
Diagram of prevalence |


|
|
The diagram of prevalence is a thematic map, illustrating prevalence of value of one of analyzed characteristics over others for concrete objects. Processed polygons are painted over by the color corresponding to the characteristic prevailing for the given object. For not polygon's objects the circle which has been painted over with color corresponding to the characteristic prevailing for the given object will be built.
|