Chart |


|
|
Properties of a component are the following: Height, Left, Name, Top, Width, Align, Chart settings.
The information echoed in the diagram is possible to save in BMP or EMF file, or to map as OLE - document. For this purpose at the moment of displaying the form it is necessary to right-click above the diagram and to select demanded data format. For changing a scale of a numerical axis by the left mouse button draw demanded area on the diagram. The combination of Shift key and the pressed right mouse button allows you to change a position of the diagram.
Description of the Chart page Each of bookmarks on Chart page is intended for parameters setup of either, one or another graph component
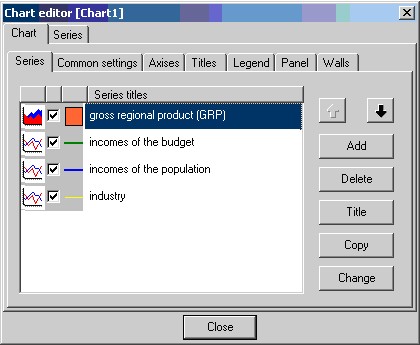
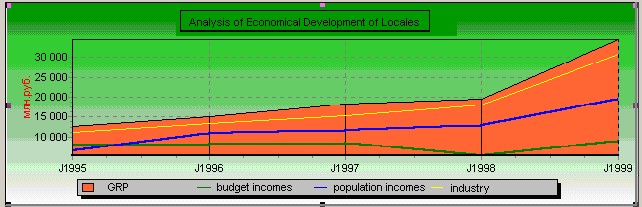
Series bookmark It contains the graph series. Set of graph points is named series. A separate line or a number of columns correspond to a series on the graph. If there are some series in a graph, some lines or a number of columns will be shown. In most cases their values are created under the identical law both two and more series are simultaneously shown in a graphics for comparing. For example, the graph consisting of four series is shown in figure. The first one demonstrates the gross regional product (GRP); the second - incomes of the budget; the third - incomes of the population; the fourth - industry.
For creation of a new series it is necessary to click Add button, and then to select the type of series in the appeared dialogue. After that there is a line of a new series will appear in the list on Series page. Here it is possible to reassign the type, color and visibility of a series, having clicked on appropriate zones. Add button is used for addition of other series, Delete button - for deleting a current series. After pressing the Title button it is possible to define the title of a series, it is necessary to click the "Title" button, press Copy button to create a new copy of the same series in the same graph, press Change button to change the type of a current series. Common settings bookmark Bookmark is used for setting graph common parameters, such as its 3Dimensions, indents from margins, possibility of zooming, scrollbars etc. Print preview button is used for graph printing, Export button - for saving of the graph as a graphics file. Axes Bookmark Bookmark is used for definition of graph axes. With the help of switches Axis it is possible to select the necessary axis - left, right, top or bottom. On a page defined by the Scale bookmark the properties of a values scale on a selected axis are set. The Auto switch determine the automatic scaling of the data - minimum and maximum are calculated dynamically, outgoing from the current values of a series. At cancellation of automatic scaling it is possible to set automatic scaling of minimum value (Minimum) or of maximum (Maximum) value (mark Auto). To set the value of a maximum and (or) a minimum manually it is necessary to click the appropriate Change button. Step of a scale on an axis is selected automatically, if Step (Desired increment) is set into 0. To set the fixed value of step it is possible, having clicked Change button. The Title bookmark is used for definition of the title text on an axis, angle of its location, size and font, by which the title is output. The Labels bookmark is used for definition of labels parameters (visibility of labels, font, angle of lean, size, interval between labels, format, style). Use the Axis ticks bookmark to set parameters of an axis line. Titles bookmark Contains tools for definition of parameters of the graph title - title text, its font, alignment etc. For example, you can see the title "Analysis of Economical Development of Locales" in the picture. Legend bookmark With the help of a Legend bookmark you can define the legend parameters - graph area, where the explaining information is located. For example, legend is arranged under the graph on the picture.
Panel bookmark It is intended for parameters setup of the panel, on which the graph is located. Walls bookmark It is intended to set parameters (visibility, background color, border, pattern, size) of the left and bottom "wall" of the graph.
Description of Series page. Is used to set series of data values. On Series page a necessary series is selected from the list of series names
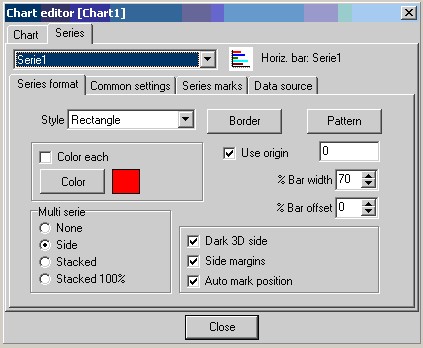
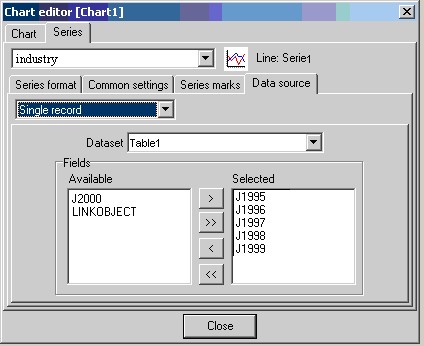
Series format bookmark Bookmark is used for definition of property of the graphic palette, graph lines and other personal settings of a current series. Common settings bookmark Data formats of the values and percents, and also legend visibility are set here. Series marks bookmark It is intended for placing of marks - the values above points of a series. Marks are displayed on a graphics, if the switch Visibility is marked. Style switches define the view of marks. Data source bookmark On Data source page the data source for a current series is defined.
The drop-down list lower of a bookmark allows to define the data source type for a series: - No data - the data source for a series is not assigned on a design stage. - Random values - set of random numbers. It may be useful at creation of preparation of a series, that visually to evaluate possibilities of this or that series without the indicating of the real data. - Dataset - allows to indicate (as the data source) a data set, the fields values of which will be used for creation of series points. Table or Query can be indicated as a data set. The Table or Query component should be located on the form and be connected to the necessary table to the moment of the fields choice. The demanded data set is selected from the Data Set drop-down list. The X list allows to select a data set field the values of which will be put aside sequentially on an abscissas axis. The Y list allow to select a data set field the values of which will be put aside sequentially on an ordinates axis. The correspondence between fields values along two axes is defined by an accessory to one record of a data set. The choice of a field in the Labels list link its values in the labels view to an abscissa axis. The character fields and fields such as date can be used as labels. Remark 1. Not all types of series demand values on X or Y axes. For series such as "pie chart", "histogram" and "horizontal histogram" it is possible to indicate values only on one of axes and value of labels. Remark 2. For series such as "surface graph" values definition on a Z axis is required. Remark 3. For series such as "bubble graph" radius definition is required. - Single record allows to indicate (as the data source) a separate record from a data set, the fields values of which will be used for creation of series points. To set a separate record as the data source, it is necessary to select a data set in the Dataset drop-down list. Then to select necessary fields from the list of available fields ("to transfer" them into the list of selected fields). Remark. Not all types of series support operations with separate record. There are the following types of series which support operations with a separate record: histograms (bar), line graph, area graph, point graph, pie chart. - Calculator allows to indicate (as the data source) a Calculator component the values of which will be used for creation of series points. The Calculator component should be located on the form to the moment of choice. To set the Calculator as the data source, it is necessary to select a necessary one from the list of available calculators ("to transfer" them to the list of selected calculators). Remark. Not all types of series support operations with Calculator. There are the following types of series which support operations with Calculator: histograms (bar), line graph, area graph, point graph, pie chart.
Example of a graph construction. To plot the chart of values of some dataset field it is necessary to do following operations:
- to create a new series and to define its type; - to set a data set for a series; - to link the necessary fields of a data set with coordinates axes and, depending on a type of a series, to set additional parameters. |