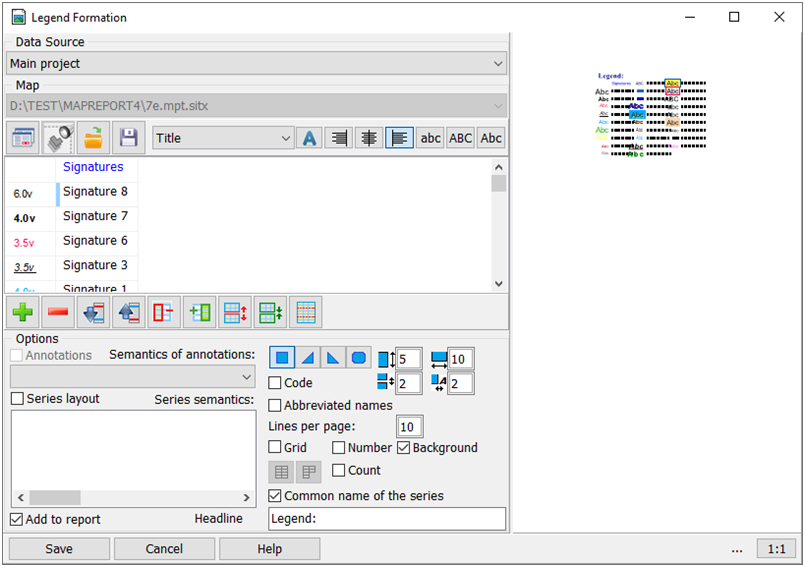
Legend Formation |


|
|
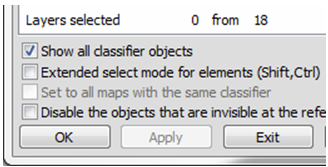
The contents of the legend table can be formed by the objects selected on the map or by setting a filter for the general list of objects contained in the classifier. At startup, the program determines whether there are selected objects on the map. If selected objects are detected, the program forms an initial list with the inclusion of a list of types of selected objects into it. The table of conventional symbols can contain objects included in only one classifier. Therefore if on the open document the objects belonging to different user maps are selected, the list is formed by the first of maps on which there are selected objects. In the future, the map by which the legend is built can be selected in the drop-down list at the top of the dialog box. When you choose a map from the list, if there are selected objects on the chosen map, the symbol table is automatically rebuilt. Otherwise the button «Generate by marked objects» will not be active. When you click the «Generate by marked objects» button again, the table of objects will be generated anew. All changes made to the table will be lost. When you click the «Generate by classifier» button, the «Map object filter» dialog box is activated, using which you can customize the composition of the legend table. Attention! At customizing the filter of objects, the option «Show all objects of classifier» should be enabled!
If at the time of activating the filter, the legend table contained objects, they will be «included» in the filter at starting. When forming a table of conventional symbols, objects are sorted in the following order:
1. By layers (in accordance with the layer number in the classifier) 2. By localizations 3. By codes of serial semantics 4. By external codes 5. By numbers in the series
Between layers the caption of a layer name is added. Lines in the table can be added, deleted, you can change their position by moving upwards or down the table, edit the text. When adding a line (insert before current line of the table), it is added as Header. Additional columns can be added to the right after the automatically generated columns. It is possible to delete only «manually» added columns. In the process of initial formation of the table of conventional symbols, a list of annotation semantics and a list of series semantics are created. Annotations - an additional column that contains the values of the specified semantics for the first object of the corresponding type found on the map. If the semantics of annotations is a classifier of values, not a numerical code is placed into the table cell, but the corresponding short name. After the annotations are generated, their text can be edited. In addition, you can add additional annotation over the images of the objects samples by directly entering text into the cell with the image. When forming the list of series semantics, only the semantics used in unidirectional series are placed into it. Series formed by two semantics are not processed. At table formation, several «serial» semantics can be used. If the «Series layout» option is disabled, samples of objects included into the series are displayed in one column, in order of increasing number in the series. If the option «Series layout» is included, before the beginning of group of the objects entering into a series, generated on the same serial semantics, the line with names of classifiers of a series (short names from the classifier of values) is inserted. Further the lines follow: one line - one series. In the case when the formation of the table is carried out by the selected objects, the number of columns in the series is determined by the minimum and maximum number of the object in the series found on the map with the addition of all intermediate ones. If the table is formed according to the classifier, the number of serial columns will correspond to the total number of values of the classified semantics. After the columns with images of objects samples of a series, there is a column with the general name of the object, which is formed by addition of individual names with separating by the «/» symbol. After the forming the table of conventional symbols, you can edit the texts of the objects names to give them a more presentable look. To carry out line breaks, insert two ~~ symbols into the text in the table cell at the line break.
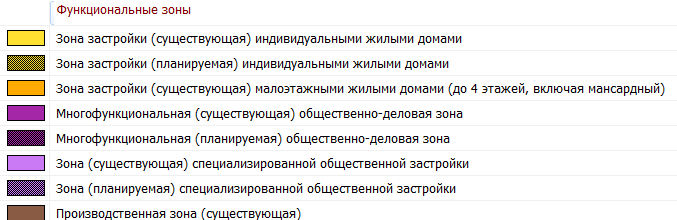
The initial list of objects without the layout of the series:
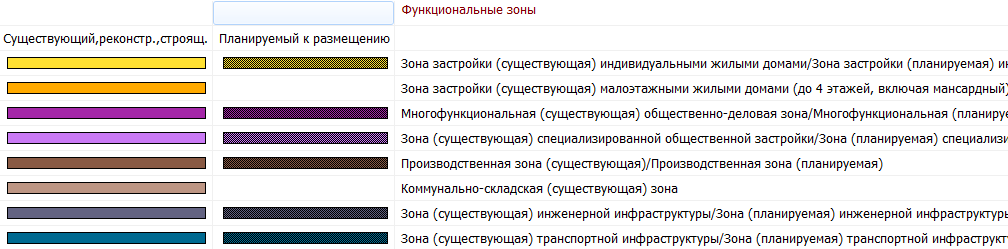
Series layout:
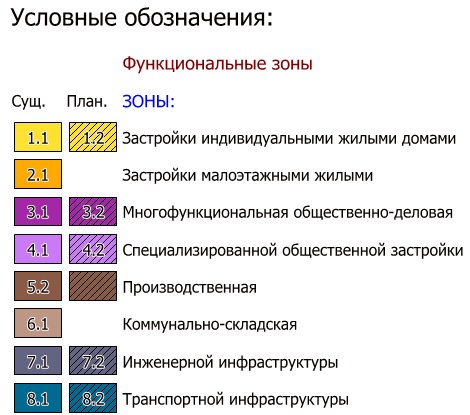
Table after corrections, with additional annotations:
The dialog window of procedure is divided in two parts. In the left part a formation and setting the parametres of the table of objects is carried out, in the right part the sample of the generated legend is displayed. In the preview window, you can evaluate the final image of the generated table. Information about the current overall dimensions of the final table in mm is placed under the preview window, which makes it possible to evaluate the format of the printed sheet on which the generated table will fully fit. The window has standard image controls: moving with the pressed left mouse button, scrolling by rotating the mouse wheel (pressing the Shift key - horizontal scrolling), scaling by rotating the mouse wheel while holding down the Ctrl key. Pressing Ctrl_W will position the entire map in the window. In the left part of a window besides editing of contents of the objects table it is possible to customize the general style of the table and styles of titles. All titles which are available in the table are subdivided into styles: 1. «Name» - the main header of the table 2. «Layers» - the caption of names of classifier layers 3. «Headers» - text in the inserted lines and the general name of a series. 4. «Body» - the main text of the table 5. «Annotations» - test of the main and additional annotations. To change a specific style, select it in the list of styles and make the appropriate settings: name, color and style of a font, method of horizontal alignment of the test, case. In addition to the main table styles, the legend can contain titles - examples of displaying objects-titles. By default as the text of the sample the text «Abc» is displayed. For assigning the concrete text as the sample it is necessary to enter it in the corresponding cell of the table in the left part of a window.
In addition, you can customize additional parameters of the legend: sizes of images of conventional symbols and line spacing, the presence of a table grid, code and numbers, options for displaying conventional symbols of areal objects. By pressing the «Save» button, you can save the generated table as a map in SITX format or as a graphic file in JPG format. If the «Add to report» option is enabled, the generated legend in the form of a map insert or image insert (depending on the selected format) is added into the center of the report. When preparing for publishing graphic documents using the Report Designer, the created legend can be added to the project using the «Add Map Insert» mode (for SITX) or the «Add image Insert» mode (for JPG).
|