Viewing matrixes of vegetation indexes |


|
|
The mode «Viewing matrixes of vegetation indexes» is intended for viewing and deleting the loaded matrixes of vegetation indexes and maps of heterogeneity according to data of remote sensing. Dialog is called from the main panel of the Complex by the button
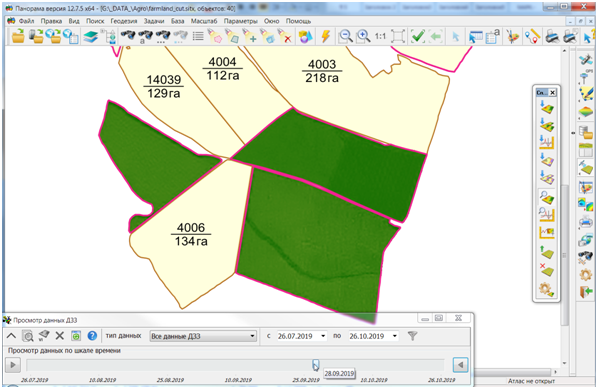
Dialog «Viewing matrixes of vegetation indexes» in a minimized form:
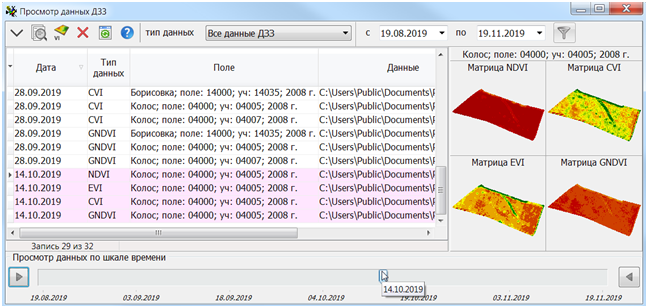
Before dialog initialization it is necessary to choose objects on a map, linked with working areas of fields. A complete list of remote sensing data for a given time interval is formed from the database for the selected objects. When the dialog is started, data is selected for 30 days from the date of the last data obtaining. Selected matrixes and maps are opened without displaying and added into the electronic map. After closing the dialog, maps and matrixes are removed from the map. For convenient tracking of the displayed data, the dialog is minimized and located in the lower left corner of the window. To expand the dialog, the button Dialog «Viewing matrixes of vegetation indexes» in expanded form:
Controlling the display of maps and matrixes: - navigation buttons - time scale slider. When you move the slider, only those maps and matrixes become visible for which the date of obtaining is closest to the date set by the position of the slider; - moving through the list of data.
Remote sensing data visible on the electronic map in the table are marked in pink color, and records that are not available for viewing become pale one. By pressing the button To change the composition of open data, a filter by date To select the displayed data, a filter by type is provided. The following data types are processed in the dialog: - All remote sensing data; - All matrixes; - All maps; - Matrix of NDVI values (NDVI); - Matrix of EVI values (EVI); - Matrix of CVI values (CVI); - Matrix of GNDVI values (GNDVI); - Map of nitrogen demand (ZN); - Map of nonhomogeneous (zoning) (ZA); - Map of NDVI nonhomogeneous (zoning) (ZNDVI); - Map of EVI zoning (ZEVI); - Map of CVI zoning (ZCVI); - Map of GNDVI zoning (ZGNDVI).
The composition of the list fields changes depending on the applied filter by data type. The general list of fields for all data contains: - Name of a field, area, crop year, crop; - Data type - the abbreviated name of the remote sensing data type; - Date of obtaining data; - Data - full path to a file on a local disk or GIS Server; - Maps of nitrogen demand - full path to the file of nitrogen demand's map on the local disk. It is filled only at viewing of the additional data of a map of nitrogen demand; - Min dose of nitrogen - the minimum dose of nitrogen application for maps of nitrogen demand; - Max dose of nitrogen - maximum dose of nitrogen application for maps of nitrogen demand; - Planned dose of nitrogen - a planned dose of nitrogen application for maps of nitrogen demand; - Construction method - a method for calculating the nitrogen's demand for maps of nitrogen demand; - Number of zones - the number of zones for zoning maps; - Date of loading of a file into a database; - Degree of nonhomogeneous - for zoning maps; - The most nonhomogeneous zone - for zoning maps; - Zones with the greatest difference - the two zones with the greatest difference from each other for zoning maps; - Productivity index - for zoning maps; - Index of nonhomogeneous - for zoning maps.
To view the maps of nitrogen demand, use the button «View additional data» . Repeated pressing the button closes a map. When viewing the map, the path to the map file is indicated in the «Maps of nitrogen demand» field. To delete the loaded data, use the button «Delete data»
Matrixes of vegetation index values are displayed with a fixed palette. For each type of index, the equal for all matrixes the correspondence of values and colors of the palette is specified. By comparing matrixes for different dates, you can study the change in the state of the field over time. The dialog allows you to view and delete the resulting matrixes onto the contour of field. For each matrix, the type of vegetation index, the full path to the file on the local disk or the GIS Server, the name of the matrix, its resolution, the date of receiving the data and the date of loading the file into the database are displayed.
|


