Formation of the report |


|
|
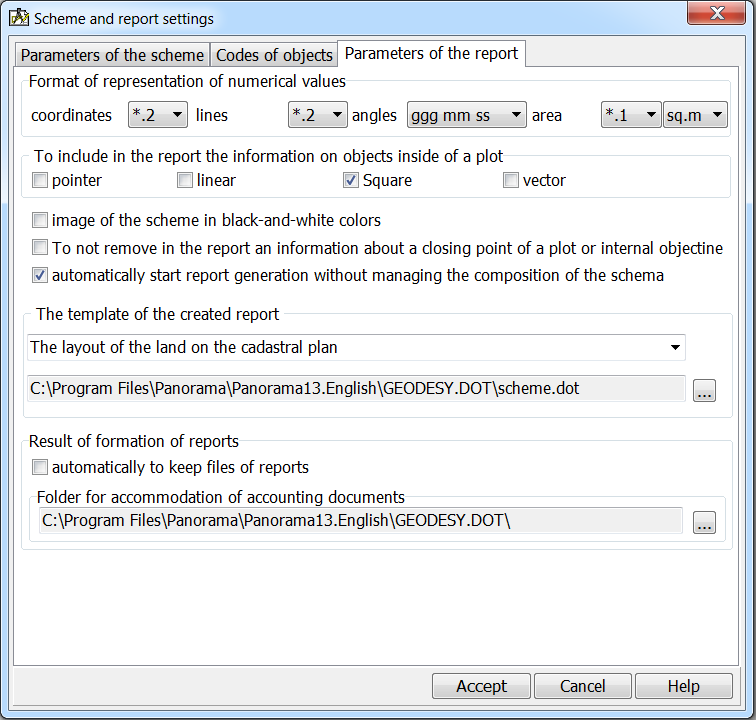
Customizing parameters of automatic creation and report filling is carried out in dialog «Formation of the scheme of a plot» on page «Parameters of the report».
In dialog you set: - Format of representation of numerical values; - Template of the created report; - Settings for filling the report.
Format of representation of coordinates in the report regulates the number of decimal places after a comma and the number of decimal places before a comma (from a decimal point to the left). Use this property for decreasing the significant positions and offloading the report. The format of representing the measures of lines determines only the number of decimal places after a comma.
The format of representation of angles allows to display the information in the report in the following options: dd mm ss.ss - degrees, minutes, seconds, hundredths of seconds; dd mm ss.s - degrees, minutes, seconds, tenths of seconds; dd mm ss - degrees, minutes, seconds; ddmm.mm - degrees, minutes, hundredths of minutes; ddmm.mm - degrees, minutes, tenths of minutes; ddmm - degrees, minutes; dd.ddd - degrees, fractions of degrees.
Formation of reports occurs on the basis of in advance prepared templates of documents. Templates consist of a unchangeable and changeable part. The changeable part of template is described by markers. The program automatically carries out replacement of markers onto the necessary information. Markers are conditionally divided onto regulated and not regulated. The regulated markers are known to the program beforehand and it in any case execute their search and clearing in case of absence of data. For the unregulated fields the program only will execute search and replacement onto corresponding data. If in a template the unregulated marker is specified, and in data there is no corresponding field of data, then the marker will be left in the report document without being replaced with data values. Below the list of the regulated markers is shown. NT number of a rotary point of object; NAMET name of a rotary point of object; X X coordinate of a rotary point of object; Y Y coordinate of a rotary point of object; DX increment of coordinates on X of a rotary point of object; DY increment of coordinates on Y of a rotary point of object; DIR direction angle of a piece of the object metrics; RUMB direction and an angle of a piece of the object metrics; UGOL rotary angle of a piece of the object metrics; UGOLIN internal corners; UGOLS sum of angles; LINE length of a piece of the metrics; AREA area of object; PAREA admissible error at calculation of the object area; DOP_FABS absolute linear discrepancy DOP_FOTN relative linear discrepancy PERIMETR length of object perimeter; NAMEOBJ name of the internal object which is being inside of object of the cadastral accounting (for example, the buildings located on a site); NTOBJ number of a rotary point of internal object; XOBJ X coordinate of a rotary point of internal object; YOBJ Y coordinate of a rotary point of internal object; DXOBJ increment of coordinates on X of a rotary point of internal object; DYOBJ increment of coordinates on Y of a rotary point of internal object; DIROBJ direction angle of a piece of the metrics of internal object; LINEOBJ length of a piece of the metrics of internal object; UGOLOBJ rotary angle of a piece of the metrics of internal object; DATA date of forming the document; PICTURE cartographical scheme of object, in scale; SCALE scale of the scheme of object.
For metric data of an object (coordinates, measures of lines and angles), filling the table with data can be carried out according to the format of the line, and not as a separate field. For the following markers, the program will automatically insert a table line and fill in the information in it, in accordance with the format of the line. Conformity of a marker and a format of a line is shown below: STR1, STROBJ1 = NT X Y DIR LINE STR2, STROBJ2 = NT UGOL LINE DIR DX DY X Y STR3, STROBJ3 = NT X Y STR3BL, STROBJ3BL = NT B L STR4, STROBJ4 = NT DIR2 LINE1 STR5, STROBJ5 = NT X Y DOP_FABS STR6, STROBJ6 = NT(i,i+1) LINE2 DIR3 DOP_FOTN
STR fields are used for the description of selected for processing map object, and STROBJ field - for the description of objects located inside the selected one. Generalized template can be multi-page, including several tables. At the same time, the format and accuracy of representing coordinates, measures of lines, areas and other geometric parameters in different tables may differ. The option of controlling these parameters through the name of the variable marker is provided. For example, when using the AREA marker, the information will be output in the format corresponding to the settings specified in the project parameters. And for variable markers, information can be displayed in other units of measurement and with a different accuracy:
AREA - area in meters according to the settings AREA0 - area in meters with rounding to the nearest integer AREA1 - area in meters with rounding to tenths AREA2 - area in meters with rounding to the nearest hundredths Area_ga - area in hectares, with rounding to two decimal places Area_km - area in square kilometers, rounded to two decimal places LINE - the length of the segment in meters in accordance with the settings LINE0 - segment length in meters with rounding to the nearest integer LINE1 - segment length in meters with rounding to tenths LINE2 - line length in meters with rounding to the hundredths.
For showing the various representations of angular sizes the following variants of markers are stipulated: DIR0, DIROBJ0 "ddd mm ss.ss" DIR1, DIROBJ1 "ddd mm ss.s" DIR2, DIROBJ2 "ddd mm ss" DIR3, DIROBJ3 "ddd mm.m" DIR4, DIROBJ4 "ddd mm.mm" DIR5, DIROBJ5 "ddd mm.mmm" DIR6, DIROBJ6 "ddd mm" DIR7, DIROBJ7 "ddd.dddd"
The DIR fields are used to describe the map object selected for processing, and the DIROBJ fields are used to describe the internal objects located inside the selected one.
To display angular values in rhumbs, markers are used:
RUMB - a direction (SW, NW, NE, SE) and a rhumb of a piece of the object metrics. The rhumb will be is deduced according to those settings which have established in parameters of the project; RUMBN - a direction of a piece of the object metrics (SW, NW, NE, SE); RUMBU - the rhumb of a piece of the object metrics will be is deduced according to those settings which have established in parameters of the project. RUMBU0 "dddmm ss.ss" RUMBU1 "ddd mm ss.s" RUMBU2 "dddmm ss" RUMBU3 "dddmm.m" RUMBU4 "dddmm.mm" RUMBU5 "dddmm.mmm" RUMBU6 "dddmm" RUMBU7 "ddd.dddd"
For output of various representation of cartographical schemes of object in scale the following variants of markers are stipulated: PICTURE - the cartographical scheme of a plot in the scale specified by the user; OUTLINE - an outline of a rotary point. For the PICTURE marker, the following options are provided for the content of the of images of the plot's scheme. PICTURE - full structure of objects specified on the scheme PICTURE1 - titles of crosses are disabled; PICTURE2 - crosses and titles of crosses are disabled; PICTURE3 - titles of lines are switched off; PICTURE4 - titles of crosses and titles of lines are disabled; PICTURE5 - crosses, titles of crosses and lines are disabled. There are several predefined combinations of images, depending on the type of report sheet: PICTURE_0 - Marking drawing, does not contain: crosses, titles of crosses, buildings, numbers of points of the ground area, zones of restriction. PICTURE_1 - Scheme of borders of the ground area, does not contain: crosses, titles of crosses, buildings, neighbours (is controlled only by parameters of the scheme), zones of restriction. PICTURE_2 - List of surveying signs (land-marks), does not contain: crosses, titles of crosses, buildings, neighbours (is controlled only by parameters of the scheme), the title of lengths of lines, zone of restriction. PICTURE_3 - Registration form, does not contain: numbers of points of buildings, neighbours (is controlled only by parameters of the scheme), titles without lengths of lines, numbers of points of zones of restriction. PICTURE_4 - Map (plan) of borders, does not contain: titles of crosses, the title of number and the area of the ground plot, number of points of buildings, neighbours, titles of lengths of lines, numbers of points of zones of restriction. PICTURE_5 - Map (plan) of borders, does not contain: crosses and titles of crosses, title of number and the area of the ground plot, neighbours, the title of lengths of lines.
To obtain the desired version of the drawing it is necessary to prepare a template - to place the necessary markers in the necessary places in the document, in the "Create schema objects and filling the report" dialog to customize the complete display composition. The program, when the key field PICTURE_i is found in the template, will automatically change the composition of the schema display by disabling the visualization of «superfluous» data determined by the marker format. When creating a scheme onto it, in addition to the object's own boundaries, rotary points and internal objects, it is necessary, in some cases, to put neighboring objects. These can be the neighboring plots, streets, public roads, etc. The processing of neighboring objects is performed according to a single algorithm. When forming the scheme, the program, by bypassing all sections of the metric of the boundaries of the plot, finds neighboring objects, determines sections of the metric that coincide with neighbors, and at the points of change of neighbors places the vector signs - an indicator of the location of neighbors. When filling out the report, the program processes the GRANICY markers - for the neighboring objects, requests the value of the NAME semantics and inserts it into the report as a string describing the metric section. For example, «from n.1 to n.9 - Petrov V.I. section», where the value «Petrov V.I. site» is the value of the semantics of the neighboring object along the metric section from 1 to 9 points. If there is no plot on any segment metric, it is considered that there are no neighbors here, and the line «common use land» is placed into the report. If neighboring objects do not have topological compatibility with the object of cadastral work, then the program will not detect them. The DATA marker is used to insert the date of the document formation into the report. Customizable markers are designed to display attribute (semantic) information in the report. The arrangement of markers in a template, a document general view, a font, etc. are customized by the user by editing the template by means of MicrosoftOffice. Customizable markers are filled according to the values of semantic characteristics. At formation of the report template such markers should receive the same names, as the key of the corresponding semantic characteristic. For example, if semantics «NAME» has key SEM9, then the key field in the template will be denoted by #SEM9#. The program, having found a matching, will replace the marker with the value of the semantics, as many times as the marker is present in the template. All markers are filled according to the principle - how many times they met in the document, so many times they were filled. The user can independently execute customization of any classifier by setting the necessary names of the semantic keys. It is possible to expand the list of attributive characteristics, simultaneously with it having added markers into templates.
|